Authenticity Verification of Acoustic Leak-Survey Recordings from Signal Microstructure
Aleksandr Ivanaiskii, PhD
Industrial AI Founder & Systems Architect
Evgeny Ivanaiskii, PhD
Domain Expert
Sergei Shipilov
AI Architecture Lead, Rivixi LLC
Abstract
In acoustic non-destructive testing (NDT) of pipelines, leak localization relies on computing the cross-correlation between two pulse-code-modulated (PCM) sensor signals and estimating the time delay of arrival. Because a standard correlator evaluates only phase coherence and passband spectral shape, a software-synthesized WAVE file with an imposed inter-channel delay is accepted by conventional diagnostic software as a valid field measurement. This study investigates the capabilities and operational limits of blind authenticity verification for acoustic leak-survey recordings based solely on the digital sample sequence without external hardware metadata. Using a benchmark corpus of 1,588 unique 16-bit PCM recordings (921 verified field recordings from correlators, hydrophones, and acoustic noise loggers; 667 synthesized waveforms across 11 parametric generator families), we evaluate 28 physical and hardware-level signal features, including spectral rolloff near the Nyquist frequency, analog-to-digital converter (ADC) least-significant-bit (LSB) parity, 50 Hz power-line harmonic contrast, temporal root-mean-square (RMS) energy variation, and inter-channel coherence. Under stratified five-fold cross-validation, a decision-tree ensemble separates field and synthetic recordings with an area under the receiver operating characteristic curve () of 1.000. Feature-contribution analysis demonstrates that classification is driven primarily by anti-aliasing filter rolloff near the Nyquist limit (34.3%), channel configuration (12.3%), and ADC word-length parity (9.5%), whereas 50 Hz power-line harmonics contribute 4.1%. However, when evaluated on the withheld Advanced Physical Leak generator family, recall drops to 0.61 at the 0.50 cutoff and to 0.00 at the 0.75 cutoff due to score compression, while passing 118 withheld synthetic signals through a second-order Butterworth low-pass filter at reduces recall at the 0.50 cutoff from 0.941 to 0.000. These results demonstrate that statistical authenticity detectors rely heavily on ADC anti-aliasing and container characteristics, which must be accounted for when designing secure NDT verification pipelines.
Keywords: acoustic leak detection; pipeline non-destructive testing; cross-correlation analysis; audio authentication; analog-to-digital conversion; synthetic signals; anti-aliasing filtering.
1. Introduction
1.1. Background and Relevance
Acoustic correlation surveying is a primary non-destructive testing (NDT) method for locating hidden leaks in buried water mains and district-heating networks. During a field survey, two vibro-acoustic transducers (piezoelectric accelerometers or hydrophones) are mounted on the pipeline straddling the inspected section, and a field recorder stores a two-channel noise recording in WAVE format. Historically, the presence of a recording exhibiting a clear correlation peak was treated as sufficient proof that the field inspection had taken place. However, modern signal-synthesis tools make it possible to generate realistic acoustic files in software without deploying sensors on site. Fabricated primary NDT records create a direct risk of missed pipeline failures, costly dry excavations, and contamination of historical databases used to train diagnostic models.
1.2. State of the Art
The physical theory of correlation leak localization and acoustic wave propagation in buried pipes has been thoroughly established in classical and modern NDT literature [1]-[5]. Independently, digital audio forensics has developed techniques for verifying spoken recordings using Electric Network Frequency (ENF) fluctuations, microphone transfer functions, and quantization traces [6]-[12]. Nevertheless, industrial vibro-acoustic recordings differ fundamentally from speech: field instruments operate at non-standard sampling rates (ranging from 4 kHz to 21 kHz), the signal is dominated by broadband turbulent noise, and vocal tract formants are absent, preventing direct transfer of speech-forensic detectors to pipeline diagnostics.
1.3. Problem Statement
A pipeline correlator computes the cross-power spectrum of two channels and locates the peak of the cross-correlation function. To pass this check, a signal only needs to contain a shared noise component within the pipe propagation band (typically 50-1,500 Hz) shifted by the target propagation delay, superimposed on partially independent background noise. An important engineering question remains unresolved: can a digital PCM recording acquired through a physical piezoelectric transducer, analog conditioning stage, and hardware ADC be reliably distinguished from a software-synthesized waveform using only the recorded samples, and how robust is such detection when the synthesizer mimics hardware filter edges?
1.4. Aim and Objectives
The aim of this study is to develop and experimentally evaluate a method for authenticating acoustic leak-survey recordings from physical and hardware-level signal microstructure, quantifying the contribution of individual acquisition-chain characteristics and testing robustness against signal post-processing.
To achieve this aim, the following objectives are addressed:
- Assemble a benchmark corpus of 1,588 verified field recordings (spanning ten industrial instrument categories) and synthesized leak waveforms (11 parametric generator families).
- Formulate a physically interpretable 28-dimensional feature space that is invariant to the instrument sampling rate and captures power-line pickup, Nyquist-edge rolloff, flow non-stationarity, and ADC quantization structure.
- Quantify the discriminative power of each physical feature individually and within a supervised decision-tree ensemble.
- Evaluate generalization across unseen generator families, withheld field instruments, and targeted post-processing operations (low-pass filtering, envelope modulation, and requantization).
1.5. Research Hypothesis
We hypothesize that parametric leak-noise synthesizers designed to reproduce a correlation peak in the low-frequency pipe passband fail to replicate secondary hardware signatures of a physical acquisition chain (specifically the analog anti-aliasing filter rolloff near the Nyquist frequency, the active bit depth of the sensor ADC, and power-line pickup), but that deliberately emulating the upper band-edge rolloff via simple linear low-pass filtering significantly closes the statistical gap between synthetic and field signals.
1.6. Scientific Novelty
- For the first time on a representative industrial leak-survey corpus, we establish the quantitative hierarchy of hardware and physical signal features separating genuine vibro-acoustic recordings from software synthesizers.
- We introduce a rate-adaptive Welch spectral estimation procedure for power-line harmonic contrast that maintains a constant 2 Hz frequency resolution across arbitrary instrument sampling rates.
- We experimentally demonstrate score-threshold drift under unseen physical leak generators and show that applying a second-order zero-phase Butterworth low-pass filter at enables synthetic waveforms to bypass fixed-threshold statistical detection without altering the low-frequency leak correlation band.
2. Literature Review
Acoustic leak localization in pressurized pipelines builds upon the generalized cross-correlation with phase transform (GCC-PHAT) introduced by Knapp and Carter [1]. Field methodology and wave propagation models for metallic and plastic mains were established by Fuchs and Riehle [2] and Gao et al. [3], while the influence of pipe material on vibro-acoustic signal transmission and automated water-network monitoring techniques were further analyzed by Butterfield et al. [4] and Chan et al. [5]. All of these diagnostic frameworks operate under the assumption that the input waveform is an authentic measurement from physical transducers.
Methods for verifying the provenance of digital recordings have been developed primarily in audio forensics and anti-spoofing research. Koenig [6] and Maher [7] established foundational protocols for examining DC offsets, phase continuity, and quantization integrity. Grigoras [8], [9] and Cooper [10] developed the ENF criterion, exploiting 50 Hz or 60 Hz power-grid interference to validate recording authenticity. In acquisition-device forensics, Kraetzer et al. [11] and Buchholz et al. [12] demonstrated that the analog front-end and anti-aliasing filter leave measurable signatures in short-time spectral coefficients.
Recent advances in synthetic audio detection and shortcut learning [13]-[15] provide critical context for industrial signal verification. Results from the ASVspoof challenges [13] and the generalization studies by Müller et al. [14] and Geirhos et al. [15] show that classifiers achieving near-perfect accuracy in standard within-corpus cross-validation frequently rely on incidental technical cues, such as high-frequency bandwidth cutoffs, container bit depth, or channel layout, rather than acoustic source physics. Applying this analytical framework to pipeline NDT signals enables a rigorous assessment of both the strengths and vulnerabilities of sample-level authenticity verification.
3. Materials and Methods
3.1. Benchmark Corpus Description
The experimental evaluation was conducted on a verified archive of 1,588 unique 16-bit linear PCM WAVE recordings, pre-screened via SHA-256 hashing of the raw sample arrays to exclude byte-level duplicates. The corpus consists of two classes.
The first class comprises field recordings (), which are authentic measurements acquired with commercial NDT instruments on operational water and district-heating pipelines:
- leak-correlator survey exports ();
- test-loop recordings under controlled flow and no-flow regimes ();
- trunk-main hydrophone recordings ();
- resampled logger archive exports ();
- verified broadband two-channel sensor recordings ();
- surface-mounted acoustic noise loggers ();
- leak recordings verified by subsequent excavation ();
- miscellaneous field surveys () and reference audio-base records ().
In addition, 67 band-limited hydrophone and logger files from the Hong Kong open water-network benchmark [16] (DOI: 10.17632/hkn8mxcjyz.1) and 29 third-party operational survey recordings were used for external testing.
The second class comprises synthesized recordings (), consisting of two-channel waveforms generated by 11 parametric simulation algorithms modeling pipeline acoustic regimes and inter-sensor delays:
- Procedural Leak () and Modified Procedural Leak ();
- Physical Leak () and Advanced Physical Leak ();
- Flat-Noise Broadband Archive ();
- Corrosion Without Discrete Leak () and Corrosion With Leak ();
- Narrowband Machinery Noise () and Broadband Machinery Noise ();
- Scripted Leak Synthesizer () and Background Alibi Generator ().
Instrument sampling rates in the archive span specialized hardware rates (4,096 Hz, 6,554 Hz, 8,092 Hz, and 21,362 Hz) as well as standard audio rates (44,100 Hz and 48,000 Hz). From each recording, up to the first 30 s of signal are analyzed (files shorter than 0.5 s are cyclically extended to the minimum window length).
3.2. Physical and Hardware Feature Extraction
A 28-dimensional feature vector is extracted from each waveform , organized into five physical groups. Single-channel metrics are evaluated on the first recording channel.
1. Power-Line Harmonic Contrast ()
Field transducers and sensor cables pick up electromagnetic interference from the 50 Hz AC power grid and its harmonics (). The harmonic contrast is defined as the average decibel difference between the spectral peak of the power spectral density within of each harmonic and the median noise pedestal across the adjacent bands:
To maintain uniform frequency resolution across instruments with different sampling rates , the Welch periodogram is computed with a segment length of samples. This guarantees a constant bin spacing of across all sampling rates (4 kHz to 48 kHz) and ensures that every harmonic window is populated with spectral bins.
2. High-Frequency Rolloff Near the Nyquist Limit () and Spectral Shape
Hardware acquisition units incorporate analog or decimation anti-aliasing low-pass filters prior to ADC output, attenuating signal energy as frequency approaches the Nyquist limit . We quantify this attenuation as the difference in mean log-spectral level (in dB) between the upper passband and the immediate Nyquist edge :
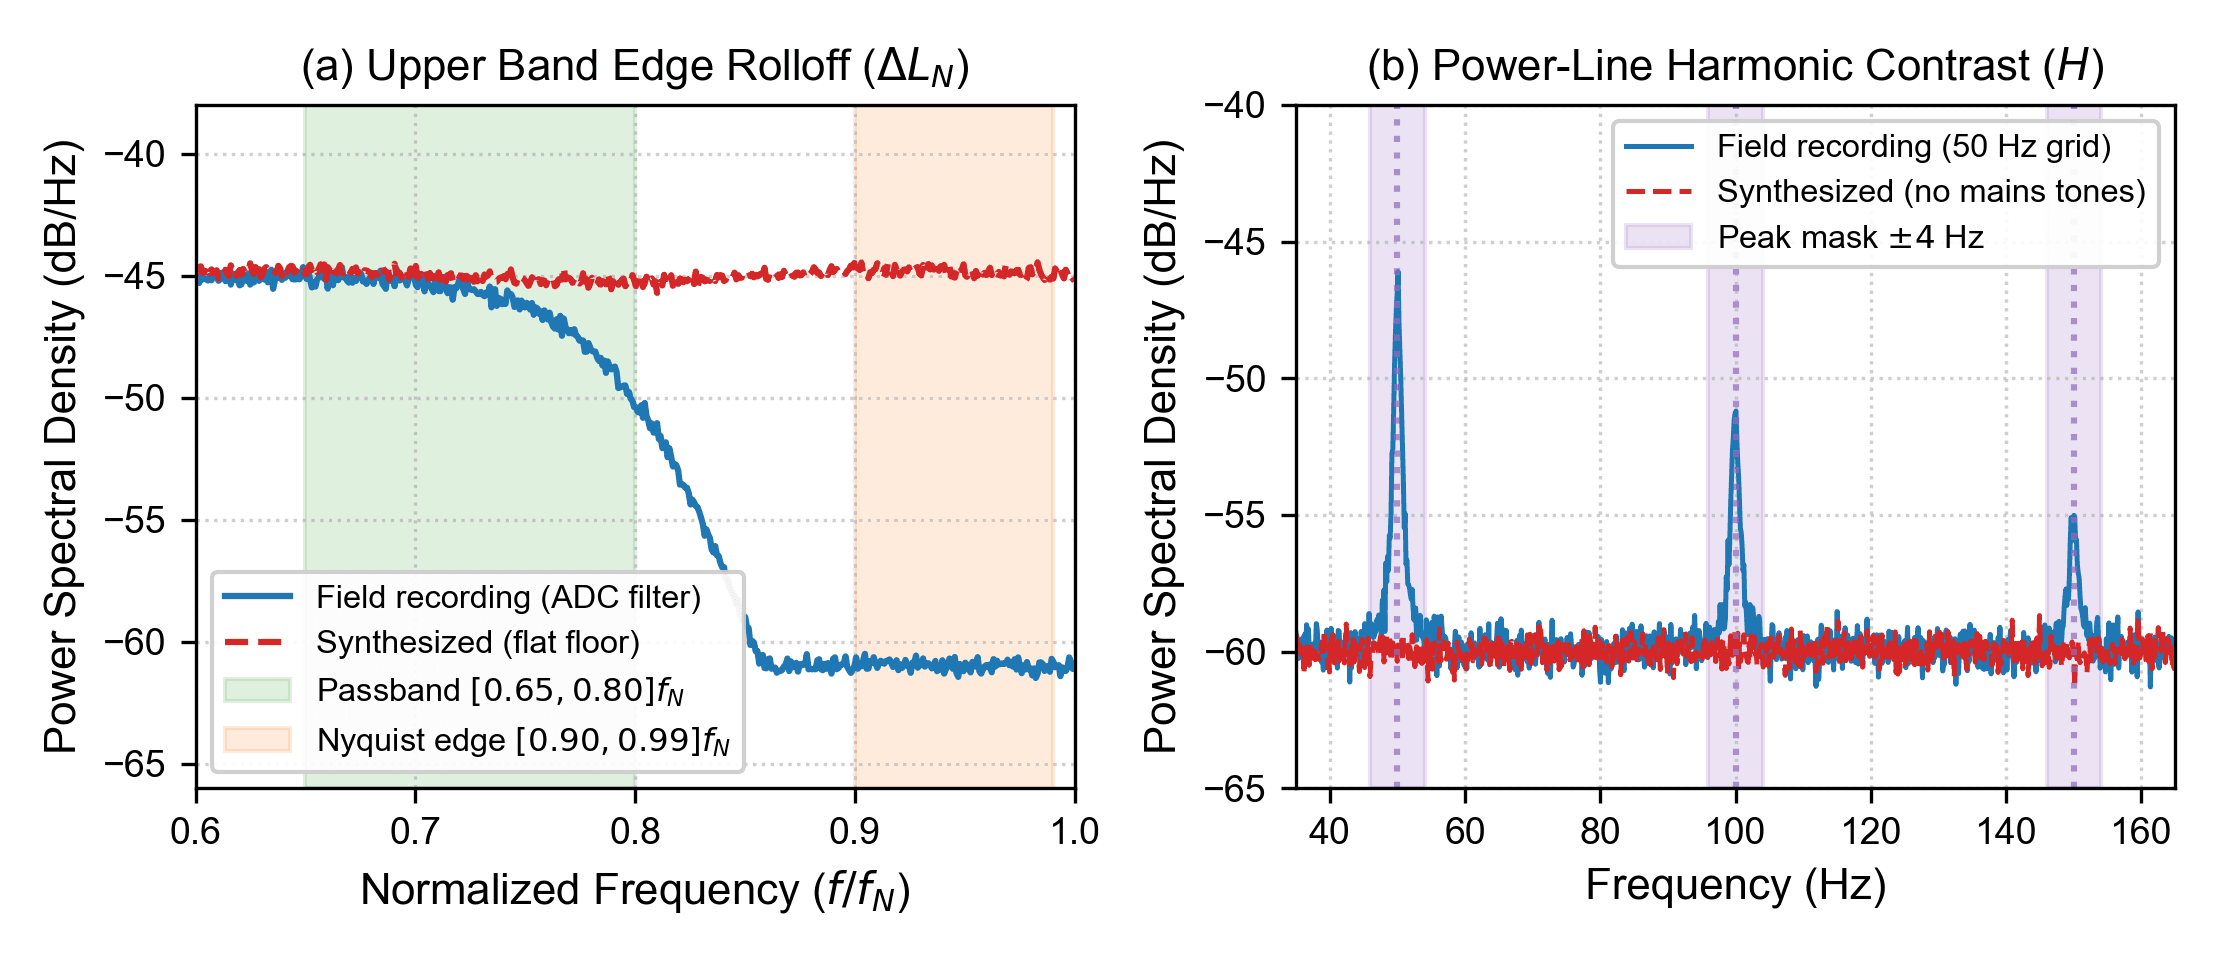
Figure 1. Physical interpretation of spectral microstructure features: (a) upper band-edge rolloff near the Nyquist frequency in field recordings caused by ADC anti-aliasing filtering versus the flat synthesized noise floor; (b) power-line harmonic contrast at 50, 100, and 150 Hz with Hz detection windows.
Additional broadband descriptors include short-time spectral flatness (the temporal average of the ratio of geometric mean to arithmetic mean magnitude spectra), spectral slope, spectral centroid, and sub-band energy ratios.
3. Temporal Energy Non-Stationarity ()
Acoustic noise in active pipelines fluctuates due to turbulent flow variations and external ambient transients. The signal is divided into consecutive non-overlapping 0.25 s blocks, the root-mean-square energy is computed for each block , and the dimensionless coefficient of variation is calculated:
where and denote the mean and standard deviation of block RMS energy across the recording.
4. DC Offset and ADC Least-Significant-Bit Parity ()
Analog preamplifiers leave a residual DC offset , while the effective bit depth of the physical ADC (often 12-bit or 14-bit sensor words left-shifted into a 16-bit WAVE container) manifests in the parity distribution of integer sample codes. The LSB parity imbalance is computed as:
where is the normalized sample sequence. Full-resolution 16-bit sequences exhibit equal proportions of even and odd integer codes (), whereas 12- or 14-bit ADC words padded with trailing zeros produce exclusively even integer codes ().
5. Channel Configuration and Inter-Channel Coherence
The extractor records a binary stereo indicator along with the mean and standard deviation of the magnitude-squared coherence spectrum between channels. For single-channel recordings, both the stereo indicator and the two coherence statistics take a value of zero.
3.3. Classification Architecture and Experimental Protocol
The classifier is a weighted ensemble of three decision-tree models:
- Random Forest (200 trees, maximum depth 12, balanced class weights, ensemble weight 0.40);
- Extremely Randomized Trees (200 trees, maximum depth 14, balanced class weights, ensemble weight 0.35);
- Gradient-Boosted Decision Trees (120 stages, maximum depth 4, learning rate 0.05, ensemble weight 0.25).
The combined detection score represents the weighted posterior probability estimate for the synthesized class. The experimental program comprised four evaluation series. In the first series, stratified five-fold cross-validation was performed across all 1,588 recordings for both the full ensemble and standalone single-feature classifiers (with optimal Youden thresholds selected solely on training folds). In the second series, generalization to unseen generators was evaluated via leave-one-family-out testing, withholding each of the 10 generator families () in turn from training and testing against a stratified control set of 184 field recordings. In the third series, leave-one-instrument-group-out evaluation was conducted by withholding entire field device categories (hydrophones, loggers, correlators, broadband sensors) as well as the 10 largest recording sessions. In the fourth series, robustness against post-processing was evaluated by applying targeted signal modifications to 118 withheld synthetic recordings (12 randomly selected files from each withheld family in Table II, and all 10 files for the Scripted Leak Synthesizer family: ), including 50/100/150 Hz harmonic injection, slow envelope modulation, DC offset shifting, 16-bit requantization, and zero-phase Butterworth low-pass filtering of orders 2 and 8.
4. Results
4.1. Statistical Distributions of Physical Features
Measured 10th, 50th (median), and 90th percentiles across the corpus highlight distinct physical and hardware differences between the two classes. For power-line harmonic contrast , field recordings yield 0.84 dB (10%), 3.85 dB (median), and 11.46 dB (90%), compared with 0.14 dB (10%), 0.40 dB (median), and 0.98 dB (90%) for synthesized waveforms. For Nyquist-band rolloff , field recordings exhibit 0.50 dB (10%), 6.75 dB (median), and 13.82 dB (90%), reflecting hardware anti-aliasing filtering, whereas synthesized recordings show negligible upper-edge attenuation at 0.62 dB (10%), 0.67 dB (median), and 0.79 dB (90%).
For temporal energy variation , the field median is 0.071 (interdecile range 0.024-0.251) versus 0.027 (interdecile range 0.015-0.049) for synthesized files, although the Corrosion With Leak generator matches the field median at 0.070. For LSB parity imbalance , field recordings have a median of 0.50 (due to 12/14-bit sensor words stored in 16-bit containers, with 10% of field files showing ), whereas synthesized files have a median of resulting from full 16-bit code utilization. Regarding channel configuration, all synthesized files (100%) are stereo, whereas 19.9% of field recordings are stereo (including 100% of verified broadband sensors and 23.7% of the excavation archive, compared with 0-0.2% of hydrophone, logger, and single-channel correlator exports).
4.2. Cross-Validation Performance and Feature Hierarchy
Under stratified five-fold cross-validation across all 1,588 recordings, the ensemble achieves . At the threshold, recall on the 667 synthesized waveforms is 1.000 with a false-positive rate () of 0.000 across the 921 field recordings; at , recall is 0.996 with .
Impurity-based feature attribution across the ensemble establishes the relative contribution of each parameter group:
- Nyquist-band level difference (): 34.3%;
- Two-channel stereo indicator: 12.3%;
- LSB parity imbalance (): 9.5%;
- Spectral flatness: 7.5%;
- Inter-channel coherence standard deviation: 5.1%;
- Absolute DC offset: 4.9%;
- Inter-channel coherence mean: 4.2%;
- Power-line harmonic contrast (): 4.1%.
Standalone classification metrics for individual features are summarized in Table I, and their empirical distributions are illustrated in Figure 2.
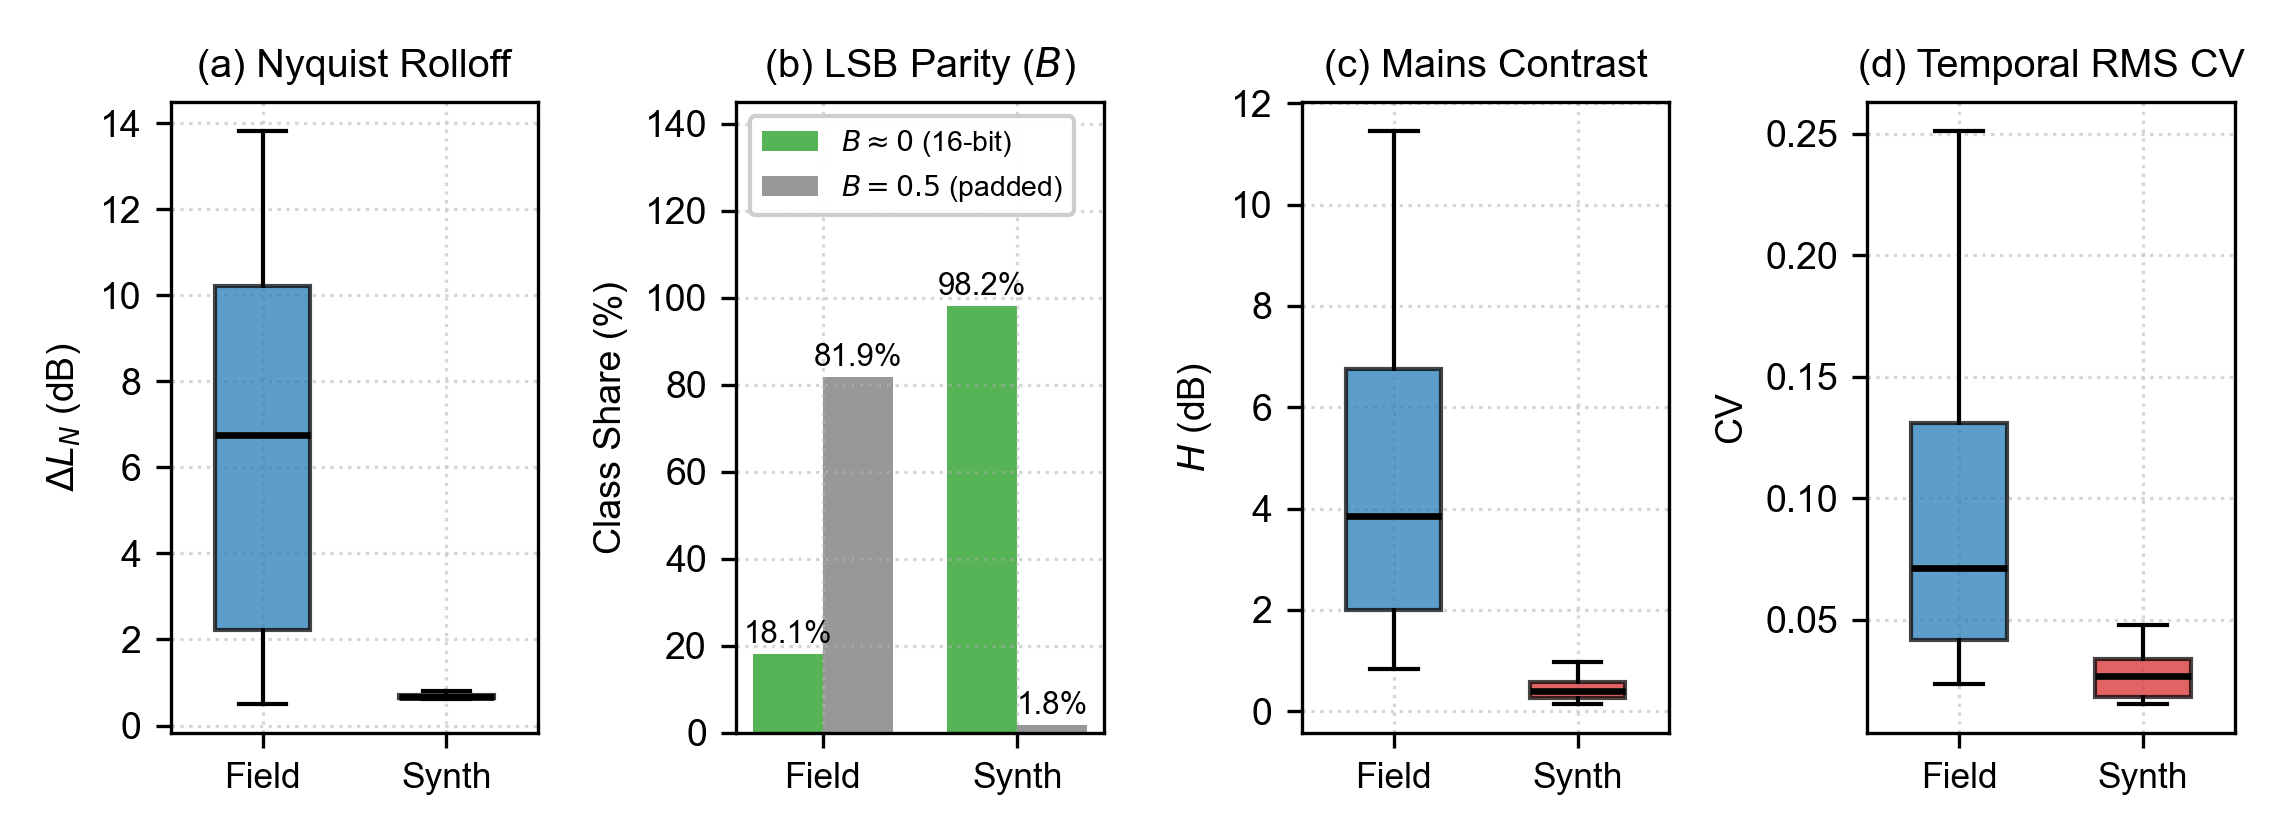
Figure 2. Empirical distributions of top signal features across field () and synthesized () recordings: (a) Nyquist-band rolloff ; (b) class shares by LSB parity regime (showing the 18.1% of field files with full 16-bit usage ); (c) power-line harmonic contrast ; (d) temporal RMS energy coefficient of variation . In panels (a), (c), and (d), boxes denote the 25th and 75th percentiles, horizontal lines indicate the median, and whiskers span the 10th to 90th percentiles.
Table I. Standalone classification performance of individual features across five-fold cross-validation ().
| Signal Feature | Mean Fold ROC-AUC | Recall | False-Positive Rate (FPR) | Synthesized Signal Characteristic |
|---|---|---|---|---|
| LSB parity imbalance () | 0.918 | 0.982 | 0.181 | Near zero (full 16-bit code usage) |
| Two-channel stereo indicator | 0.901 | 1.000 | 0.199 | Two-channel stereo layout |
| Nyquist-band rolloff () | 0.893 | 0.999 | 0.116 | Minimal attenuation near |
| Power-line harmonic contrast () | 0.893 | 0.889 | 0.102 | Weaker 50/100/150 Hz peaks |
| Spectral flatness | 0.890 | 0.954 | 0.312 | Flatter broadband spectrum |
| Absolute DC offset | 0.869 | 0.699 | 0.004 | Lower residual DC offset |
| RMS coefficient of variation () | 0.834 | 0.859 | 0.226 | More stationary energy envelope |
4.3. Generalization to Unseen Generators and Field Instruments
Table II presents detection performance when each generator family is completely withheld from training. Across all ten splits, the false-positive rate on the 184 withheld field recordings remained 0.000.
Table II. Detection performance on unseen synthetic generator families withheld from training (evaluated against 184 withheld field recordings, ).
| Withheld Generator Family | Sample Size | ROC-AUC | Recall at 0.50 | Recall at 0.75 | Mean Score |
|---|---|---|---|---|---|
| Modified Procedural Leak | 120 | 1.000 | 1.00 | 1.00 | 0.985 |
| Procedural Leak | 130 | 1.000 | 1.00 | 0.99 | 0.782 |
| Physical Leak | 100 | 1.000 | 1.00 | 1.00 | 0.983 |
| Advanced Physical Leak | 100 | 1.000 | 0.61 | 0.00 | 0.521 |
| Flat-Noise Broadband Archive | 60 | 1.000 | 1.00 | 1.00 | 0.985 |
| Corrosion Without Discrete Leak | 50 | 1.000 | 1.00 | 1.00 | 0.995 |
| Corrosion With Leak | 50 | 1.000 | 1.00 | 0.92 | 0.893 |
| Narrowband Machinery Noise | 20 | 1.000 | 1.00 | 1.00 | 0.897 |
| Broadband Machinery Noise | 20 | 1.000 | 1.00 | 1.00 | 0.923 |
| Scripted Leak Synthesizer | 10 | 1.000 | 1.00 | 1.00 | 0.973 |
While nine of the ten families achieve 1.00 recall at the 0.50 threshold, the Advanced Physical Leak family exhibits pronounced score compression: its mean detection score drops to 0.521, reducing recall to 0.61 at and 0.00 at despite maintaining . Although lowering the decision threshold to would retrospectively recover 100% recall on this family at zero false positives on the field control set, operational deployments rely on pre-set cutoffs that fail under score calibration drift (Figure 3).
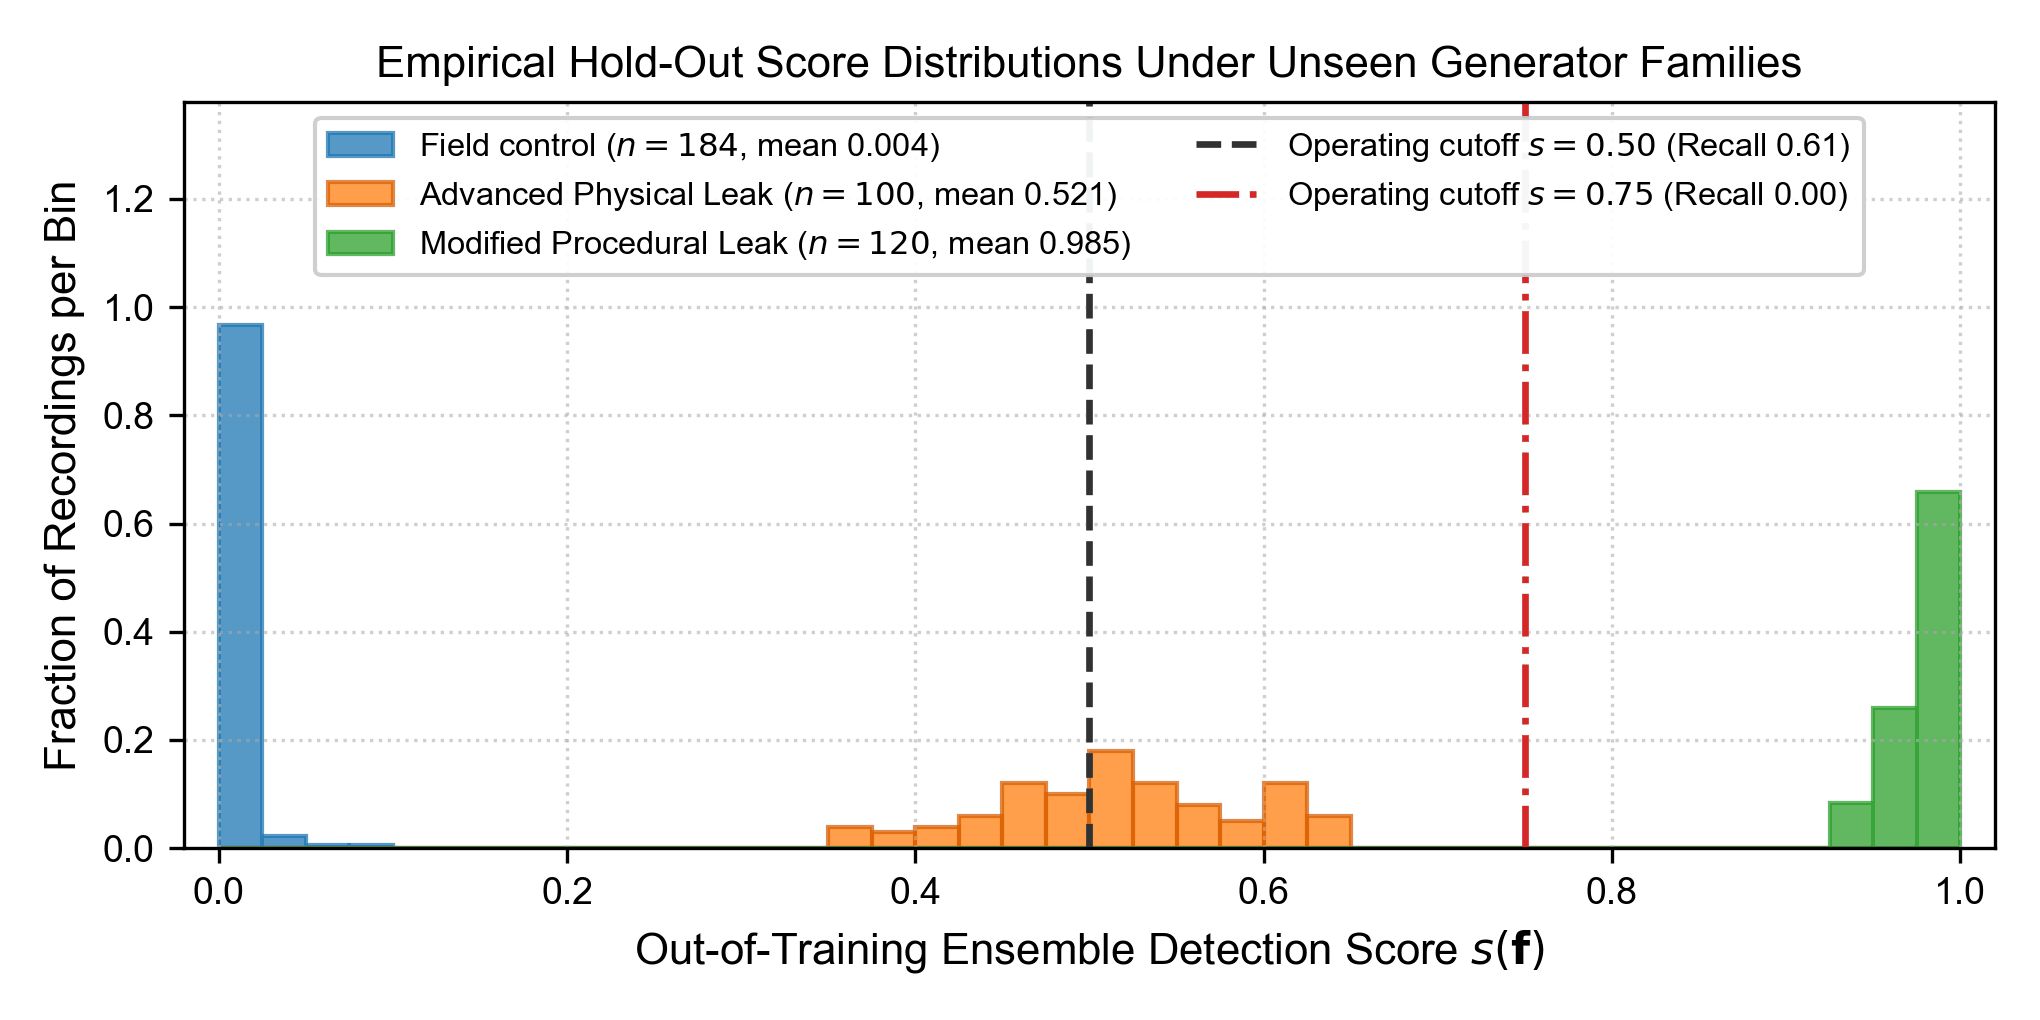
Figure 3. Empirical out-of-training score histograms : the field control set () clusters tightly near zero (mean 0.004), the Modified Procedural Leak family () clusters near 1.0 (mean 0.985), whereas the withheld Advanced Physical Leak family () shifts into the 0.35-0.65 range (mean 0.521), falling entirely below the fixed 0.75 threshold.
In leave-one-instrument-out tests withholding entire field categories (hydrophones, noise loggers, correlator surveys, flow test loops, and the 100%-stereo verified broadband group) as well as the 10 largest field sessions, the false-positive rate at was 0.000 in every test. On the external collection of 67 band-limited Hong Kong recordings [16], the median score was 0.057 with zero false alarms, while across the 29 unlabeled third-party operational recordings the median score was 0.078 (with 4 of 29 recordings, or 13.8%, scoring at or above 0.50; because these external field measurements lack independent ground-truth provenance, those 4 flagged files cannot be definitively disambiguated between unverified synthetic signals and false alarms on atypical instrument channels, which is why this set is reported separately from labeled accuracy metrics).
Table III compares feature measurements for three two-channel recordings acquired at the same hardware sampling rate of (the negative value for field Record A reflects high-frequency mounting resonance of a broadband piezoelectric accelerometer near the upper band edge, residing in the left tail of the field distribution).
Table III. Comparison of authentic and synthesized two-channel recordings at .
| Parameter | Record A (Field) | Record B (Synthesized) | Record C (Synthesized) |
|---|---|---|---|
| RMS coefficient of variation () | 0.187 | 0.034 | 0.037 |
| Nyquist-band rolloff (dB) | |||
| Ensemble detection score | 0.0001 | 0.9998 | 0.9999 |
4.4. Robustness Against Signal Post-Processing
Table IV summarizes the impact of targeted post-processing modifications applied to the pool of 118 withheld synthetic recordings (baseline recall is 0.941 at the 0.50 threshold and 0.890 at the 0.75 threshold; mean score is 0.891).
Table IV. Effect of signal post-processing operations on synthetic audio detection ( withheld recordings).
| Post-Processing Operation | Mean Score | Recall at 0.50 | Recall at 0.75 |
|---|---|---|---|
| Unmodified baseline synthetic signal | 0.891 | 0.941 | 0.890 |
| DC offset injection (matched to field median) | 0.879 | 0.941 | 0.873 |
| 16-bit requantization with shift | 0.891 | 0.941 | 0.890 |
| Power-line harmonic injection (50, 100, 150 Hz) | 0.822 | 0.898 | 0.788 |
| Slow amplitude envelope modulation (0.25 s step) | 0.703 | 0.907 | 0.492 |
| Zero-phase 2nd-order Butterworth LPF () | 0.393 | 0.000 | 0.000 |
| Zero-phase 8th-order Butterworth LPF () | 0.153 | 0.000 | 0.000 |
| Combined chain (LPF + DC shift + requantization) | 0.137 | 0.000 | 0.000 |
5. Discussion
5.1. Engineering Interpretation of Results
The experimental findings confirm the research hypothesis and clarify the physical mechanisms governing statistical authentication of NDT audio recordings. The leading contribution of (34.3% ensemble weight) reflects a fundamental hardware distinction. Physical acquisition units incorporate analog or digital decimation anti-aliasing filters ahead of ADC output to prevent spectral folding, resulting in pronounced attenuation in the band relative to (field median difference of 6.75 dB). Because software synthesizers generate discrete-time noise directly without an anti-aliasing stage near , their upper band edge remains flat ().
The high standalone predictive power of LSB parity () and channel count (12.3% weight) stems from industrial recorder architecture: many field instruments digitize signals using 12- or 14-bit ADCs left-shifted into 16-bit WAVE files, and export single-sensor logger data as mono files. Importantly, withholding the 100%-stereo verified broadband field group yielded , confirming that the ensemble does not misclassify authentic stereo recordings solely due to channel count.
As shown in Table IV, adding 50 Hz mains tones or slow amplitude modulation only modestly affects detection. By contrast, passing synthetic waveforms through a zero-phase second-order Butterworth low-pass filter at (affecting only the uppermost 3% of the Nyquist band, well above the 50-1,500 Hz pipeline correlation passband) matches the integrated summary statistic across to the field distribution and reduces detection recall at both operating thresholds to zero. Notably, as seen in Figure 4a, this filter matches only the window-averaged level difference rather than the full transition shape: hardware anti-aliasing begins rolling off gradually near , whereas the filter drops sharply only past . Incorporating transition-shape descriptors (such as the corner frequency and transition bandwidth) would expose a simple cutoff, although an adaptive generator could similarly adjust filter order and cutoff frequency to match the target ADC curve. The mechanism of this vulnerability and the preservation of the diagnostic cross-correlation peak are illustrated in Figure 4.
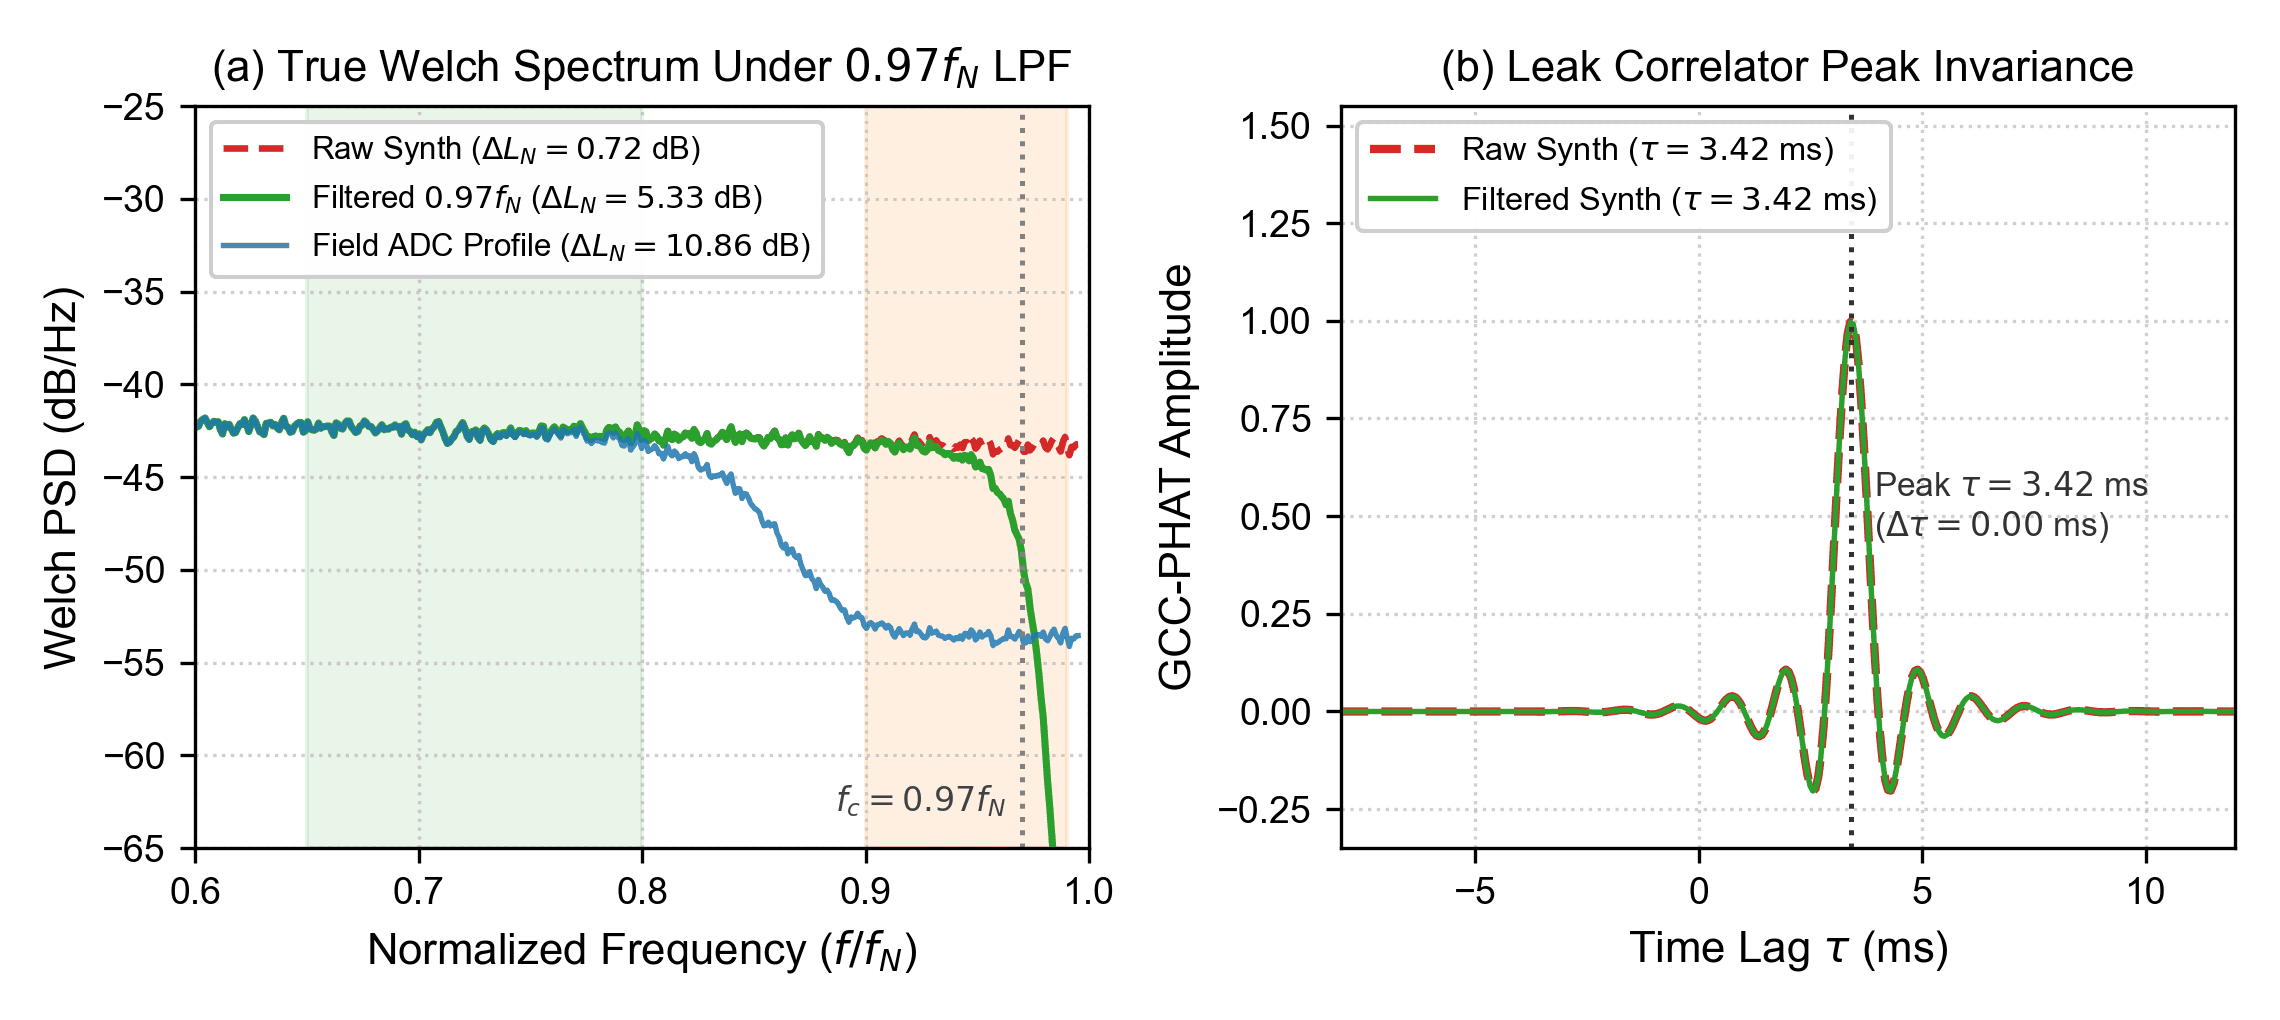
Figure 4. Emulation of hardware rolloff via low-pass filtering: (a) Welch spectra of raw synthetic noise, filtered synthetic noise after zero-phase 2nd-order Butterworth filtering (), and a hardware ADC anti-aliasing profile; (b) invariance of the GCC-PHAT cross-correlation peak ( ms) before and after filtering.
5.2. Comparison with Prior Research
The reliance of the tree ensemble on upper band-edge rolloff and quantization word length aligns closely with findings in speech anti-spoofing and shortcut learning (Yamagishi et al. [13], Müller et al. [14], Geirhos et al. [15]), which demonstrated that high cross-validation accuracy often reflects bandwidth and quantization regularities. In the context of pipeline leak detection (Gao et al. [3], Butterfield et al. [4]), our results expose a critical frequency-domain separation: diagnostic leak correlation resides in the lower frequency band (below 1.5-2 kHz), whereas blind statistical authentication relies heavily on the uppermost Nyquist edge () and least-significant quantization bits.
5.3. Limitations of the Study
Three practical limitations should be noted when applying these findings:
- The corpus originates from regions operating on a 50 Hz power grid (harmonics at 50, 100, and 150 Hz); deploying the extractor in 60 Hz jurisdictions (such as North America) requires centering the harmonic masks at 60, 120, and 180 Hz.
- The 11 synthetic families represent parametric acoustic and physical pipeline models rather than neural audio vocoders.
- Byte-level SHA-256 deduplication removes identical copies, but standard file-level cross-validation still shares recording sessions and generator families across folds; therefore, the leave-one-family-out (Table II) and post-processing (Table IV) experiments provide the realistic benchmark of operational generalization.
6. Conclusion
We developed and evaluated a 28-feature statistical authentication framework across 1,588 unique pipeline leak-survey recordings, introducing a rate-adaptive Welch window () that guarantees uniform 2 Hz resolution for power-line harmonic analysis across heterogeneous sampling rates.
Although the tree ensemble achieves under standard within-archive cross-validation, its decision boundary is governed primarily by hardware anti-aliasing rolloff near the Nyquist limit (34.3%), channel configuration (12.3%), and ADC LSB parity (9.5%). Encountering a more realistic physical leak generator compresses detection scores downward (reducing recall at the 0.75 cutoff to 0.00), and filtering synthetic signals with a second-order Butterworth low-pass filter at reduces recall at the 0.50 cutoff from 0.941 to 0.000 without disturbing the low-frequency leak correlation band.
From a practical standpoint, blind analysis of PCM signal microstructure is an effective tool for screening naive software fabrications and auditing archive consistency, but cannot serve as a standalone defense against synthesis pipelines that emulate target ADC filter rolloff and bit depth. Future work should combine sample-level microstructure verification with cryptographic or steganographic watermarking embedded directly at the sensor acquisition stage.
Acknowledgments and Declaration of Generative AI Usage
During the preparation of this work, the authors used Generative AI and Large Language Model (LLM) tools solely as an assistive technology for cross-lingual drafting, technical translation from the authors' primary working language, grammatical refinement, and manuscript formatting. All scientific hypotheses, physical and mathematical problem formulations, experimental software implementations, empirical data processing, and analytical conclusions were independently developed, executed, and verified by the authors. The authors retain full personal and academic responsibility for the integrity and content of this publication.
References
[1] C. Knapp and G. C. Carter, "The generalized correlation method for estimation of time delay," IEEE Trans. Acoust., Speech, Signal Process., vol. 24, no. 4, pp. 320-327, 1976.
[2] H. V. Fuchs and R. Riehle, "Ten years of experience with leak detection by acoustic signal analysis," Appl. Acoust., vol. 33, no. 1, pp. 1-19, 1991.
[3] Y. Gao, M. J. Brennan, P. F. Joseph, J. M. Muggleton, and O. Hunaidi, "A model of the correlation function of leak noise in buried plastic pipes," J. Sound Vib., vol. 277, no. 1-2, pp. 133-148, 2004.
[4] J. D. Butterfield, R. P. Collins, and S. B. M. Beck, "Influence of pipe material on the transmission of vibroacoustic leak signals in real complex water distribution systems: case study," ASCE J. Pipeline Syst. Eng. Pract., vol. 9, no. 3, art. no. 05018003, 2018.
[5] T. K. Chan, C. S. Chin, and X. Zhong, "Review of current technologies and proposed intelligent methodologies for water distributed network leakage detection," IEEE Access, vol. 6, pp. 78846-78867, 2018.
[6] B. E. Koenig, "Authentication of forensic audio recordings," J. Audio Eng. Soc., vol. 38, no. 1/2, pp. 3-33, 1990.
[7] R. C. Maher, "Audio forensic examination," IEEE Signal Process. Mag., vol. 26, no. 2, pp. 84-94, 2009.
[8] C. Grigoras, "Digital audio recording analysis: the Electric Network Frequency (ENF) criterion," Int. J. Speech Lang. Law, vol. 12, no. 1, pp. 63-76, 2005.
[9] C. Grigoras, "Applications of ENF criterion in forensic audio, video, computer and telecommunication analysis," Forensic Sci. Int., vol. 167, no. 2-3, pp. 136-145, 2007.
[10] A. J. Cooper, "The electric network frequency (ENF) as an aid to authenticating forensic digital audio recordings: an automated approach," in Proc. AES 33rd Int. Conf., Denver, CO, USA, 2008.
[11] C. Kraetzer, A. Oermann, J. Dittmann, and A. Lang, "Digital audio forensics: a first practical evaluation on microphone and environment classification," in Proc. 9th ACM Workshop Multimedia Security, 2007, pp. 63-74.
[12] R. Buchholz, C. Kraetzer, and J. Dittmann, "Microphone classification using Fourier coefficients," in Information Hiding (LNCS 5806), 2009, pp. 235-246.
[13] J. Yamagishi, X. Wang, M. Todisco, M. Sahidullah, J. Patino, A. Nautsch, X. Liu, K. A. Lee, T. Kinnunen, N. Evans, and H. Delgado, "ASVspoof 2021: accelerating progress in spoofed and deepfake speech detection," in Proc. ASVspoof 2021 Workshop, 2021, pp. 47-54.
[14] N. M. Müller, N. Evans, H. Tak, P. Sperl, and K. Böttinger, "Harder or different? Understanding generalization of audio deepfake detection," in Proc. Interspeech, 2024, pp. 1215-1219.
[15] R. Geirhos, J.-H. Jacobsen, C. Michaelis, R. Zemel, W. Brendel, M. Bethge, and F. A. Wichmann, "Shortcut learning in deep neural networks," Nat. Mach. Intell., vol. 2, pp. 665-673, 2020.
[16] T. Zayed et al., "Hong Kong open water distribution network benchmark dataset," Mendeley Data, V1, 2022, doi: 10.17632/hkn8mxcjyz.1.
Citation
This research paper is permanently archived as a preprint on Zenodo:
Ivanaiskii, A., Ivanaiskii, E., & Shipilov, S. (2026). Authenticity Verification of Acoustic Leak-Survey Recordings from Signal Microstructure [Preprint]. Zenodo. https://doi.org/10.5281/zenodo.23654083