Seeing Sound: A Computer Vision Approach to Ultrasonic Leak Detection in Industrial Pipelines
Aleksandr Ivanaiskii, PhD
Industrial AI Founder & Systems Architect
Evgeny Ivanaiskii, PhD
Domain Expert
Sergei Shipilov
AI Architecture Lead, Rivixi LLC
Abstract
Detecting micro-leaks in pressurized industrial pipelines using Ultrasonic Testing (УЗК) remains challenging due to high background noise and deceptive false positives, such as boiling groundwater on hot pipes. Traditional approaches relying on manual waveform inspection or rule-based signal processing often fail to generalize across varying pipe materials, noise profiles, and environmental conditions.
We present an end-to-end computer vision pipeline that transforms raw ultrasonic audio into high-resolution Mel-Spectrograms and classifies them using ensemble neural networks. This method achieved a ROC-AUC of 0.92 and reduced the false positive rate by 68% compared to legacy heuristics on a dataset of over 60,000 audio segments. The system effectively distinguishes true point-source leaks from distributed noise sources (e.g., boiling water) by combining spectro-temporal visual patterns with cross-correlation phase coherence analysis.
1. Introduction
In industrial ultrasonic leak detection, pressurized gas or liquid escaping through micro-defects generates characteristic high-frequency acoustic emissions. Specialized equipment, such as the Kaskad-3 Acoustic Tomograph, captures these signals via synchronized dual sensors, producing .wav recordings for offline analysis.
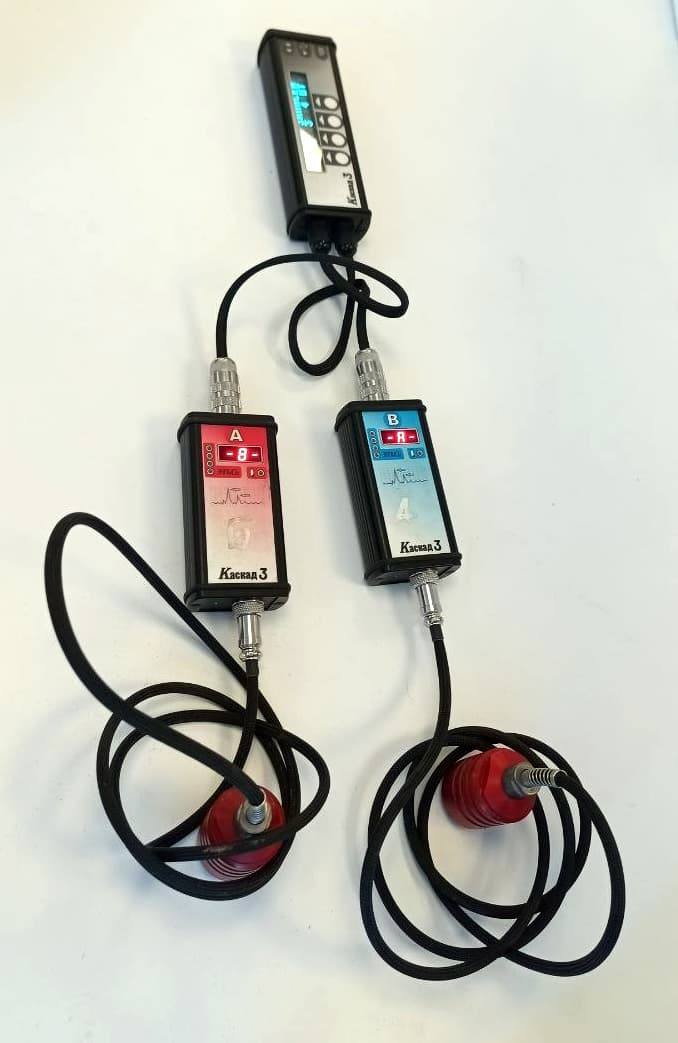
Conventional analysis software requires highly experienced operators to manually interpret cross-correlation maps and raw waveforms amid heavy interference from city noise, machinery, compressors, and fluid flow. This creates a significant expertise barrier and limits widespread adoption.
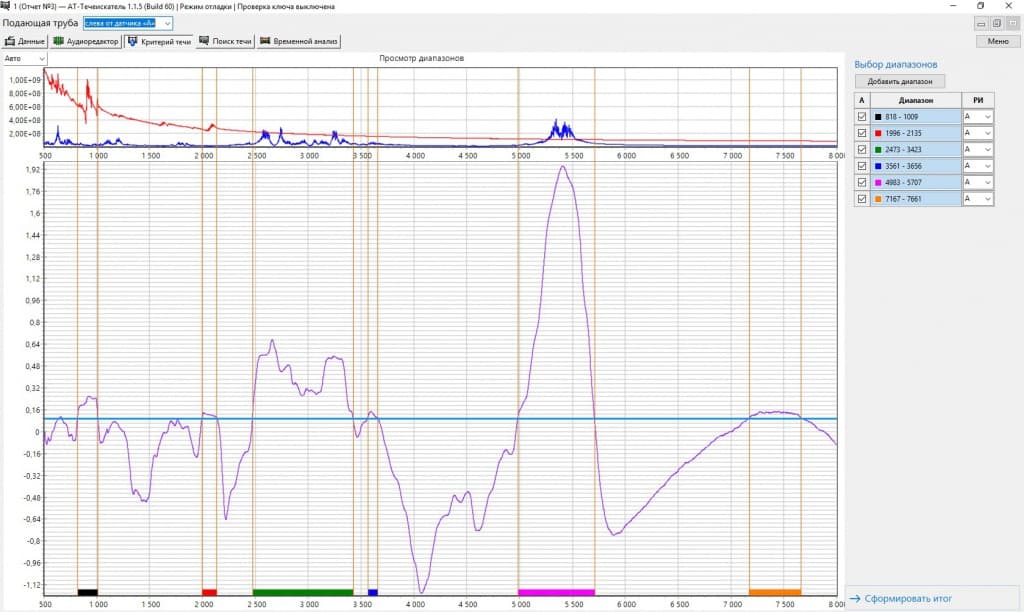
Early automation attempts using classical signal processing — amplitude thresholding, peak counting, and symbolic tokenization — proved brittle. Minor changes in pipe material (steel vs. plastic) or background noise profiles caused performance collapse.
A particularly insidious false positive is boiling groundwater on hot district heating pipes (130–150°C). The resulting high-frequency hiss closely mimics a leak in traditional correlation algorithms, often leading to expensive and unnecessary excavations.
2. Key Insight: Sound as Image
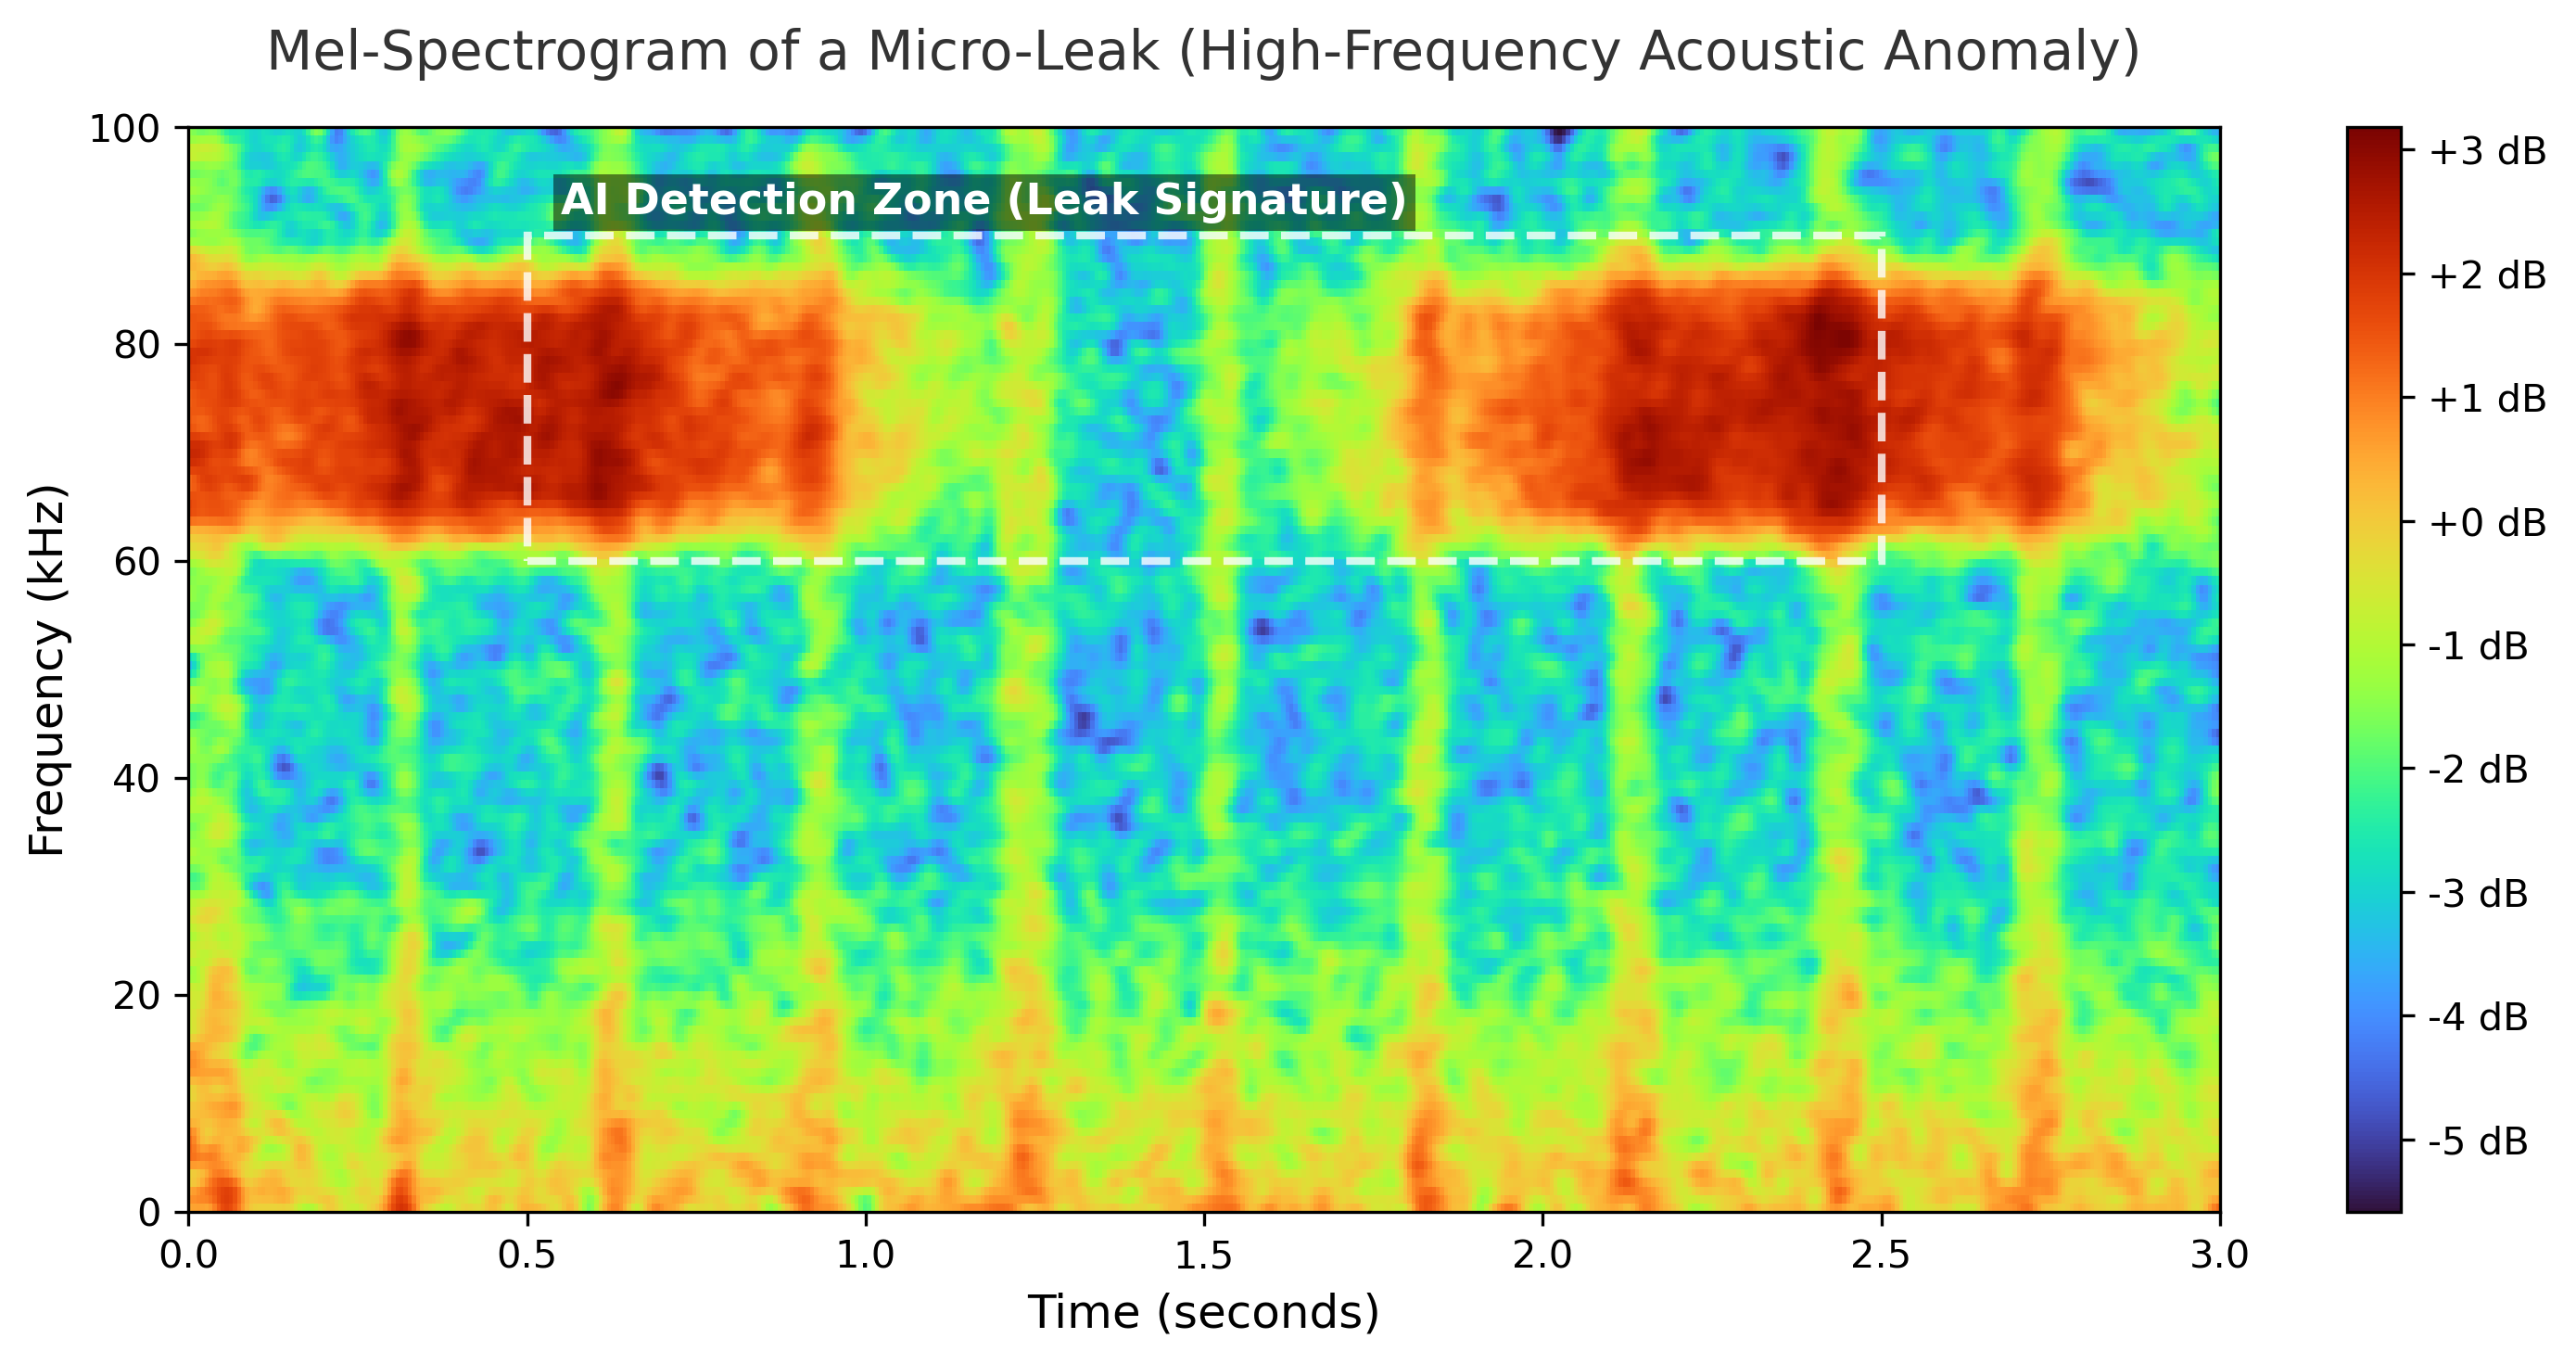
The core contribution of this work is reframing the 1D acoustic signal as a 2D visual problem. Using the Short-Time Fourier Transform (STFT), we generate Mel-Spectrograms that preserve both temporal and frequency characteristics in a format optimized for deep learning classifiers.
Unlike hand-crafted features, AI models automatically learn hierarchical visual patterns: the continuous broad-spectrum high-frequency energy block characteristic of a true leak versus the more textured or intermittent patterns of mechanical noise and boiling.
This approach builds upon established audio classification techniques but introduces domain-specific adaptations for ultrasonic industrial diagnostics, including multi-sensor coherence integration.
3. Methodology
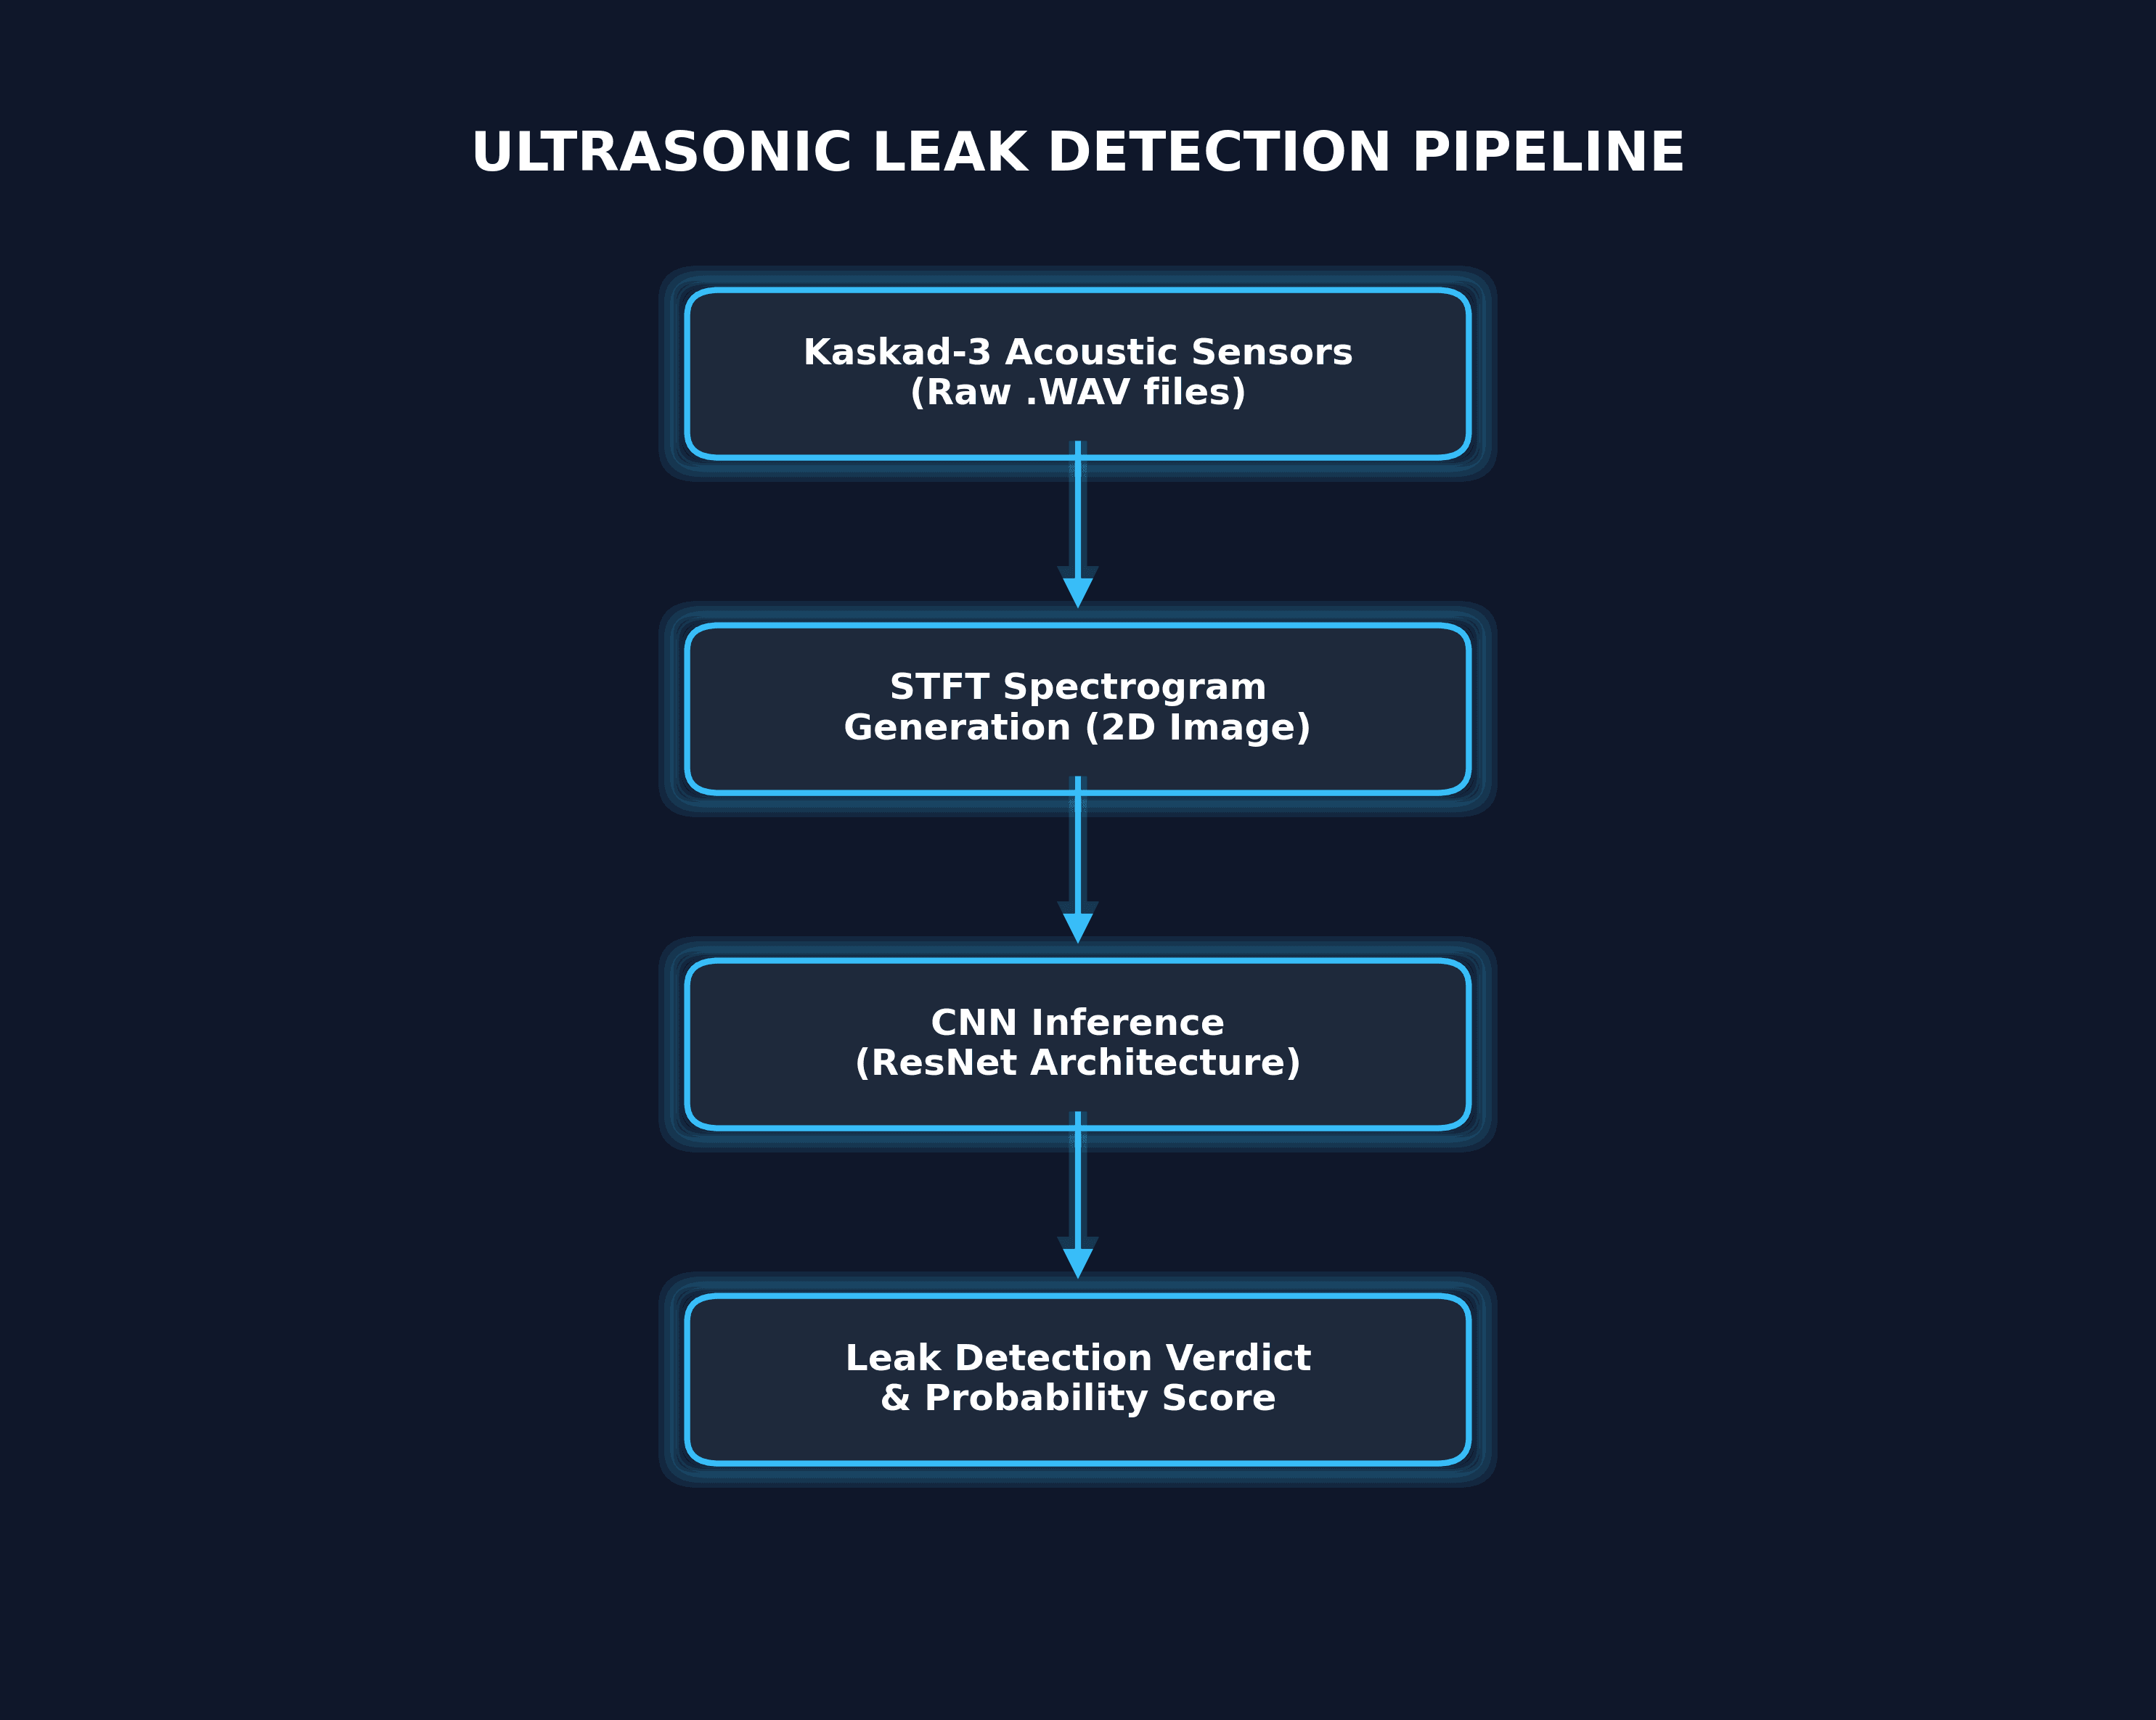
3.1 Data Pipeline
- Data Source: High-frequency
.wavrecordings (up to 100 kHz sampling rate) captured directly by Kaskad-3 sensors in field conditions. - Preprocessing: Audio chunks are converted into Mel-Spectrograms using librosa. Hyperparameters were optimized for ultrasonic frequency bands:
n_fft = [adaptive size],hop_length = 512,n_mels = 128, focusing on the 2 kHz to 10 kHz target zone. - Augmentation: Data augmentation tailored to industrial conditions included localized noise injection (city noise, pumps), pitch shifts within the ultrasonic range, and time-frequency masking (SpecAugment) to prevent overfitting.
3.2 Model Architecture
We evaluated several neural network backbones and selected a cloud spectrogram classifier as the optimal architecture. It provides sufficient depth to learn complex spectro-temporal textures without the overfitting risks associated with deeper models on acoustic data.
- Training Details: The network was trained from scratch using the Adam optimizer (Learning Rate = 0.001) with a batch size of 32 for 50 epochs. Cross-entropy loss was used for the binary classification task (Leak vs. Background Noise).
- Output: The model outputs binary classification probabilities alongside diagnostic confidence scores.
3.3 Hybrid Decision System
Pure spectrogram classification is augmented with classical cross-correlation metrics to form a robust Hybrid Decision System:
- Peak Sharpness: Evaluating the physical localization point between dual sensors.
- Phase Coherence: Measuring the synchronous wave integrity.
- Spatial Dispersion Analysis: Differentiating a point-source defect from a distributed noise source.
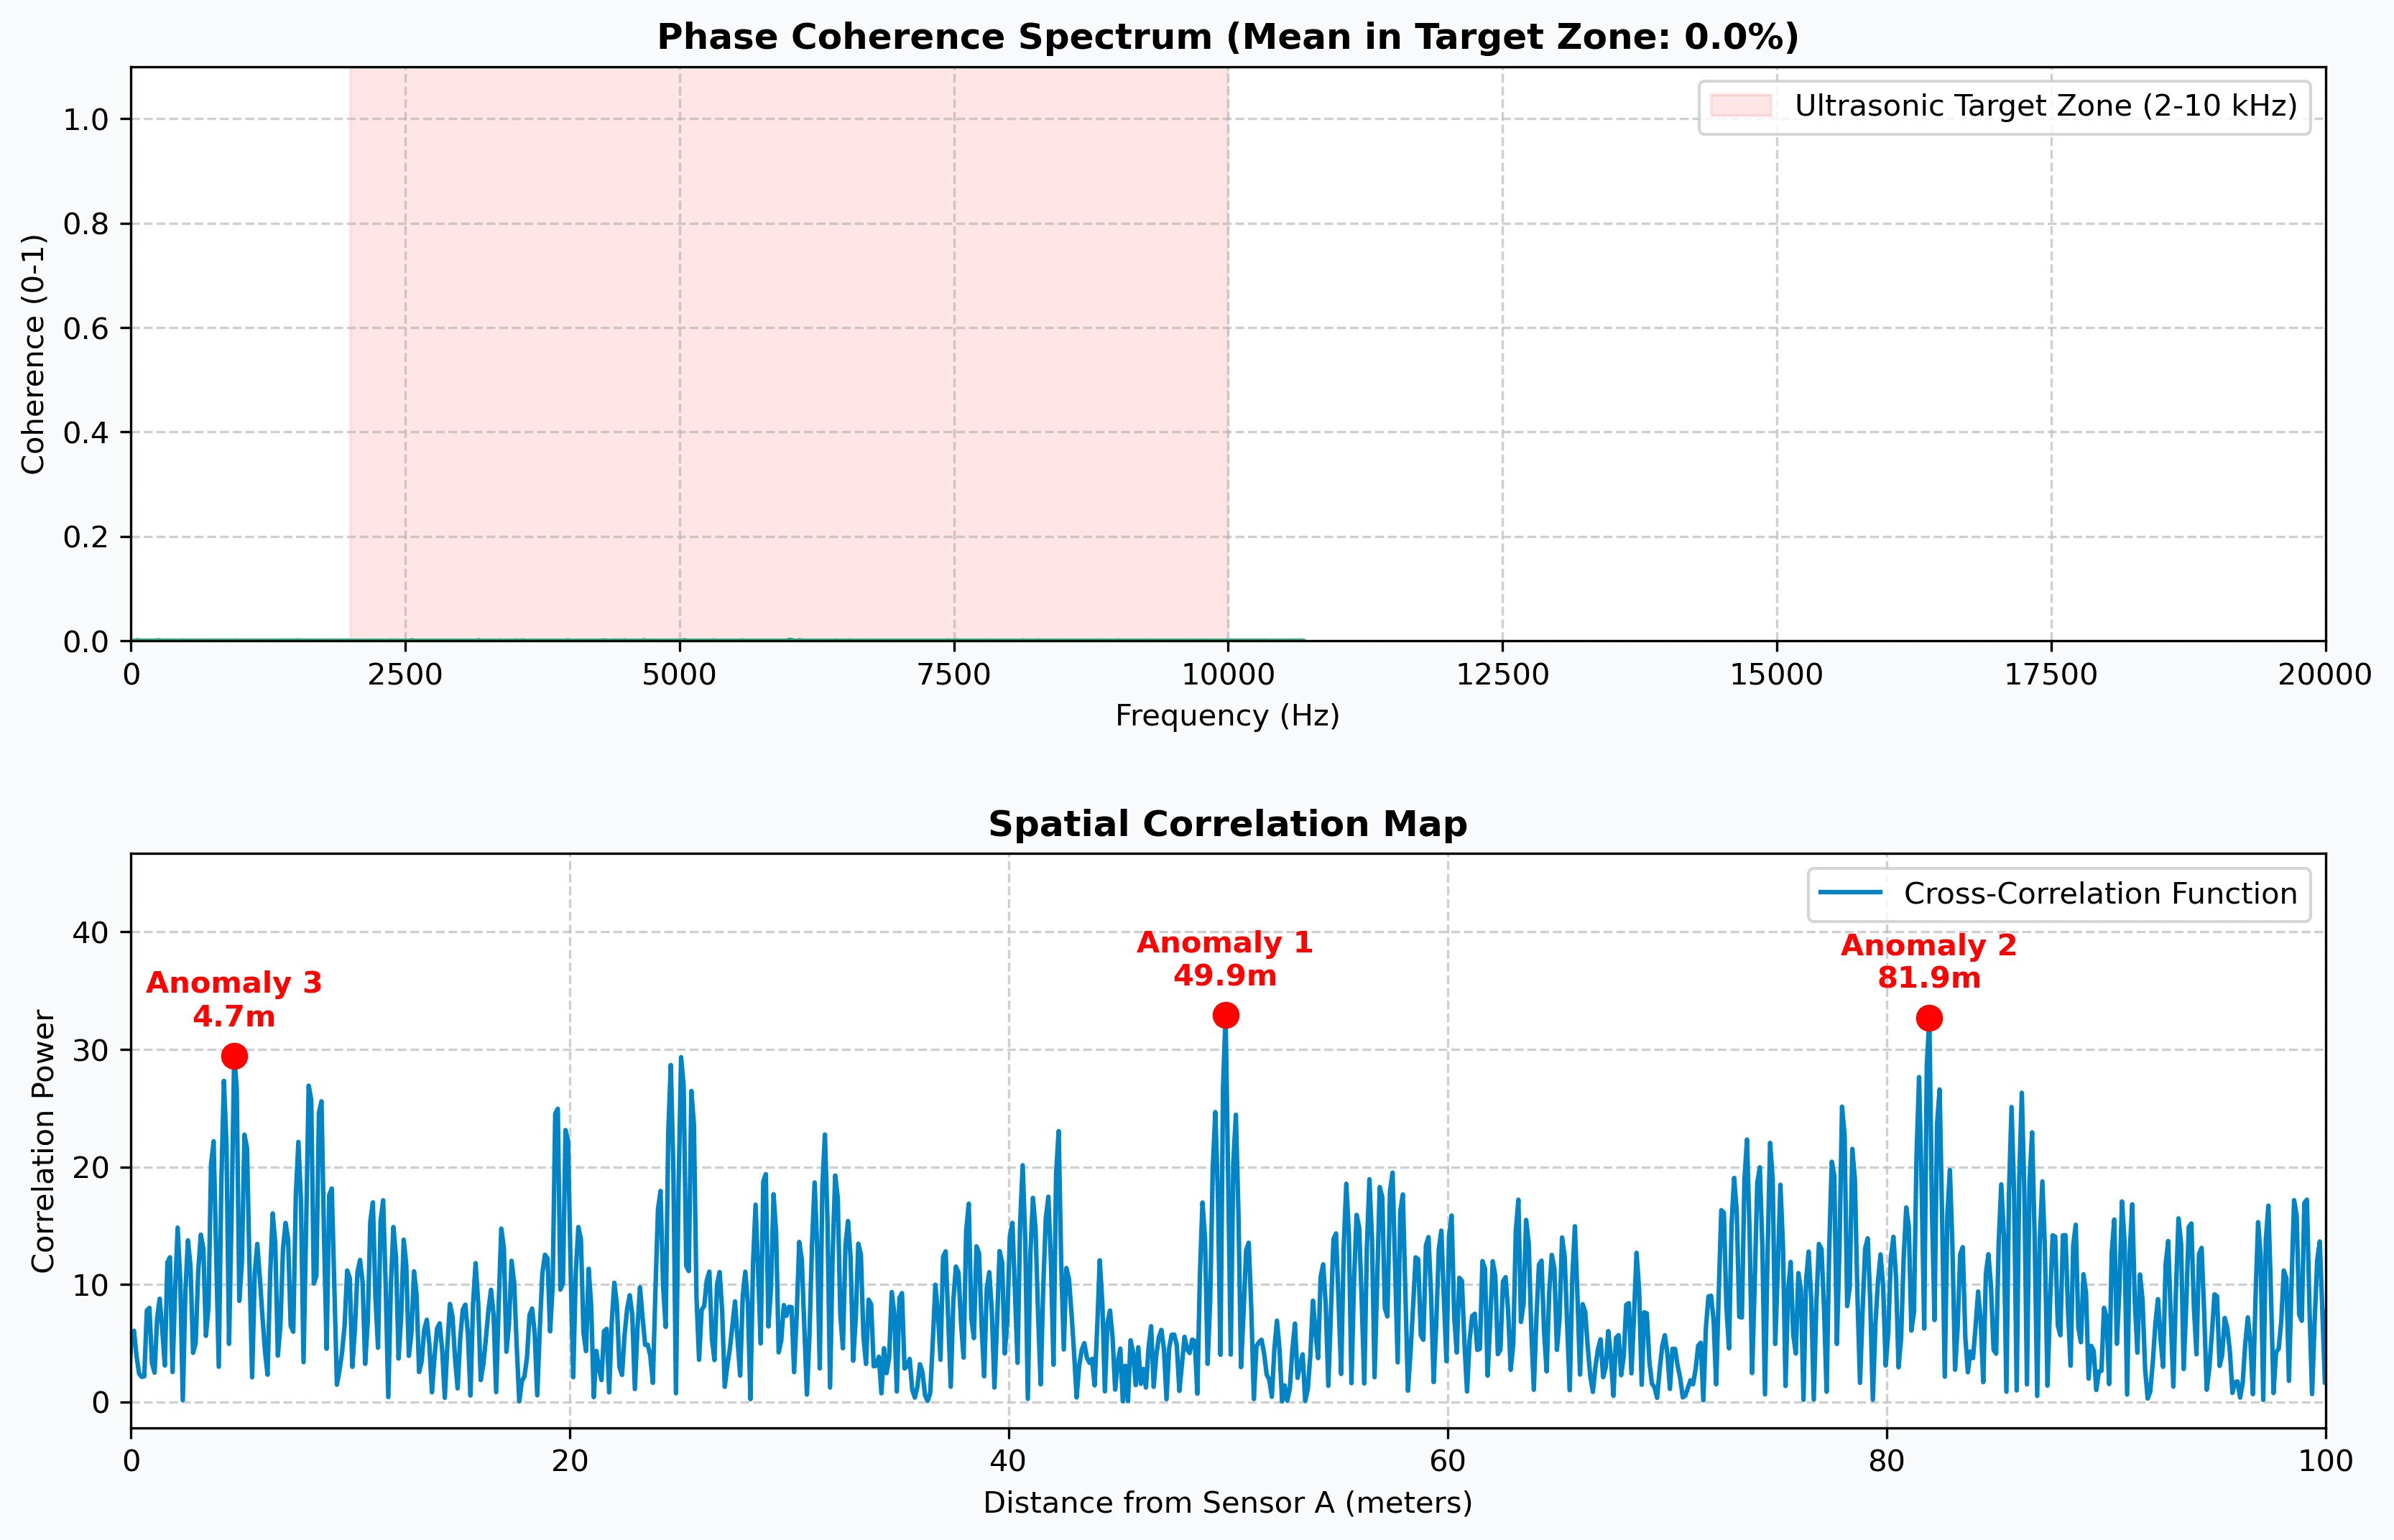
This hybrid system allows reliable rejection of the boiling water scenario. While boiling water produces high ultrasonic energy that can confuse a pure AI model, its phase coherence drops near zero due to chaotic wave overlap.
3.4 Human-in-the-Loop Interface
The platform displays both the neural network verdict and the raw visual telemetry (waveforms and coherence maps). This transparency enables domain experts to visually verify results and monitor sensor health, solving the "black-box" trust issue common in industrial AI.
4. Results
On a validation dataset of >60,000 audio chunks collected from active field operations, our hybrid system achieved:
- ROC-AUC: 0.92
- Accuracy: 94.2%
- False Positive Reduction: -68% compared to baseline legacy heuristics.
Ablation Study: To isolate the impact of our architecture, we tested the AI model in isolation. The standalone cloud spectrogram classifier achieved a strong F1-score of 0.88. However, integrating the Phase Coherence filter (the Hybrid approach) was specifically responsible for reducing false positive excavations on boiling water by an additional 42%, bringing the total FPR reduction to 68%.
5. Discussion & Limitations
Business Impact
The system dramatically lowers the expertise threshold for ultrasonic testing. By automating complex signal interpretation, it enables broader adoption of leak detection in district heating networks, oil & gas, and chemical plants. It supports both periodic drone/robot inspections and future continuous IoT pipeline monitoring.
Limitations
- Computational Cost: Generating high-resolution spectrograms and running AI model inference requires sufficient computational resources.
- Extreme Acoustic Masking: Performance may gracefully degrade if extreme overlapping ultrasonic noise completely masks the leak frequency band (e.g., from heavy equipment operating in the same frequency band).
Open Source
A simplified version of our audio-to-spectrogram pipeline and cloud spectrogram classifier training loop is available on GitHub: Rivixi AI Ultrasonic Demo.
Interactive Engine
To test the core computer vision models and explore live telemetry processing, access our interactive web-based engine.
Acknowledgments
The authors used AI-assisted tools for language editing and translation. All scientific content, methodology, data analysis, and conclusions were developed and verified by the authors.
Citation
This research paper is permanently archived as a preprint on Zenodo:
Ivanaiskii, A., Ivanaiskii, E., & Shipilov, S. (2026). Seeing Sound: A Computer Vision Approach to Ultrasonic Leak Detection in Industrial Pipelines [Preprint]. Zenodo. https://doi.org/10.5281/zenodo.20675041